U.S. Solar Industry, One Year Post-Order
In November of 2012 the U.S. International Trade Commission found that the U.S. solar industry was materially injured by imports of crystalline silicon photovoltaic cells and modules from China. Previously the Department of Commerce determined that imports were being sold in the U.S. at less than fair value with dumping rates of 18.32-249.46 percent and subsidy rates of 14.78-15.97 percent for the various Chinese producers and exporters, specific company rates are shown in the table below.
Duty Rates for Solar Cells and Modules from China
**missing table**
Source: Department of Commerce.
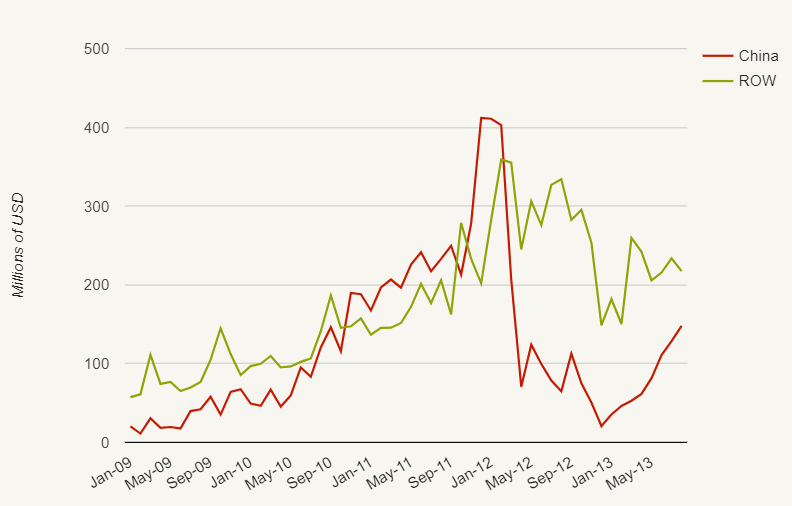
The duties have had a discernible effect on both imports from China and from the rest of the world (ROW). Monthly imports from China peaked at about $400 million in late 2011 and early 2012 just prior to the Department of Commerce instituting preliminary duties in May of 2012. Chinese imports subsequently experienced a significant decline while non-subject imports increased somewhat. However total imports remain below the levels achieved before the imposition of duties. The countries making up the largest value share of U.S. imports through August 2013 are Malaysia, China, Taiwan, Mexico, and the Philippines.
U.S. Imports of Solar Cells and Modules from China and the Rest of World (ROW), 2009-2013 YTD
Source: U.S. ITC Dataweb imports of HTS 8541.40.6020 & 8541.4060.
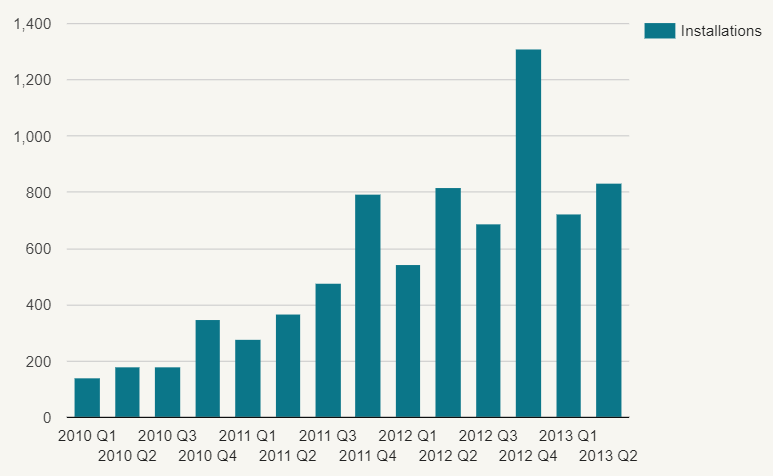
U.S. solar photovoltaic installations since the imposition of the order have remained on an upward trend. Total installations spiked noticeably in the fourth quarter of 2012 due to an increase in utility installations. Otherwise trends in residential, non-residential, and utility installations have remained fairly constant from 2012 to 2013.
U.S. Solar Photovoltaic Installations
Source: SEIA U.S. Solar Market Insight Reports.
The average price paid for solar modules in the U.S. has shown signs of stabilizing in recent quarters. While the price continued to declined 9.3 percent in 2012 Q4 and 5.9 percent in 2013 Q1 these decreases were not as steep as they had been prior. Furthermore in 2013 Q2 the average price paid for a solar module increased for the first time in years, as it grew by 6.3 percent. In contrast from first quarter of 2011 through the third quarter of 2012 the price for solar modules in the U.S. declined by an average of 12.5% quarter over quarter.
U.S. Solar Module Price
Source: SEIA Solar Market Insight Reports.
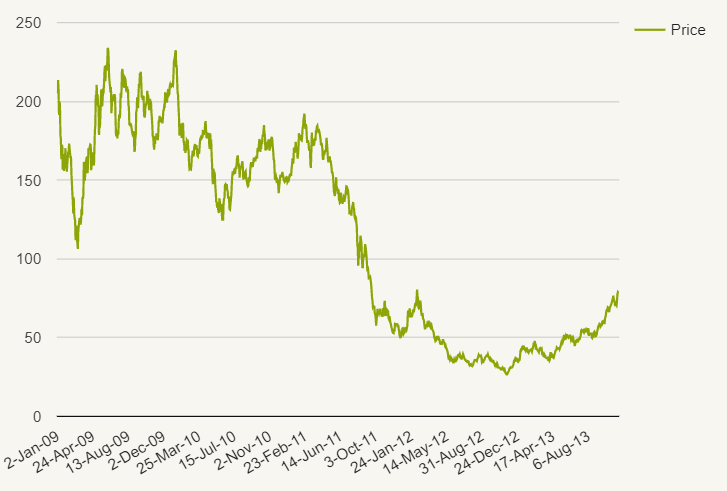
On the whole, the global solar industry is still struggling with issue of over supply which has plagued the industry for a number of years. The European Union, also struggling with excess supply from China, recently came to a special arrangement with China which avoides duties on dumped product but ensures that a minimum price for solar modules is in place. Chinese producers are also experiencing financial problems due to their excess capacity and supplies. After years of increasing capacity and solar production, in 2013 one of China’s largest solar producers, Suntech, was forced to file for bankruptcy. Overall fallout from the global over supply of solar modules has adversely affected industry players. The Market Vectors Solar Energy ETF, a stock index of global solar industry, has fallen drastically in recent years. Prior to 2010 the ETF often traded in excess of $200 a share but from the start of 2010 through most of 2012 the fund went into a free fall before bottoming out in November 2012 at $26.80. Since the U.S. duties went into place the ETF has rebounded to approximately $78, but still remains only a fraction of its former value.
Market Vectors Solar Energy ETF (KWT) Daily Closing Price
Source: Yahoo Finance.
The imposition of duties against Chinese solar photovoltaic cells and modules appears to be having a positive effect on the U.S. Solar Industry. Still, depressed valuation suggest that the industry remains troubled.


